 initiative")
Sentinel Landscapes (SL) initiative
- Scientist: Tor-G. Vågen
- July 19, 2017, 5 p.m.
- Donor : CGIAR Research Program on Forests, Trees and Agroforestry (FTA)
- Grant Ref :
- Members :
The Sentinel Landscapes (SL) initiative is comprised of geographic areas or sets of areas with a broad range of biophysical, social, economic and political conditions.
The Sentinel Landscapes (SL) initiative is comprised of geographic areas or sets of areas with a broad range of biophysical, social, economic and political conditions. A core component of the SL network is a set of Land Degradation Surveillance Framework (LDSF) sentinel sites, where intensive data collection is taking place using co-located biophysical and socio-economic surveys in order to collect information on a number of social-ecological indicators. The initial set of SL sites were established in 2012, growing into a network of 10 landscapes by the end of 2014.
Project layers, maps and documents
Sentinel Sites - Land Degradation Surveillance Framework
- June 6, 2016, 7:39 a.m.
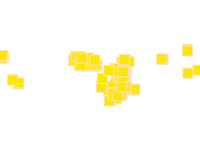
Land Degradation Surveillance Framework Sentinel sites - center points.
El Tuma LDSF sentinel site
- Aug. 10, 2014, 2:19 a.m.
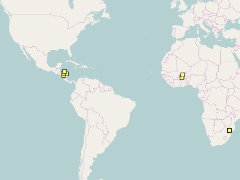
Sampling points in Nicaragua sampled as part of the Sentinel Landscapes initiative - El Tuma Sentinel Site.
FTA Sentinel Landscapes - sites completed August 2014
- Aug. 5, 2014, 4:28 a.m.
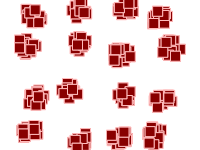
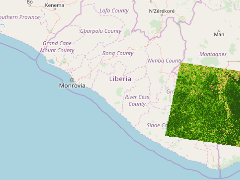
Location of LDSF sentinel sites that have been completed as part of the Sentinel Landscapes Initiative.
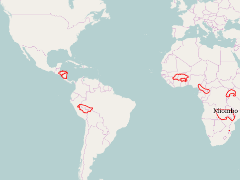
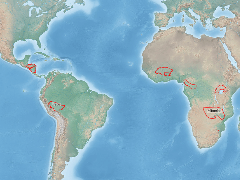
Sentinel Landscapes Boundaries (2013-2015)
- April 23, 2015, 10:01 a.m.
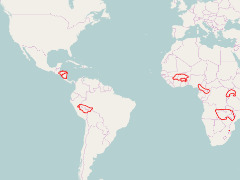
FTA Sentinel Site boundaries as per April 2015. This layer is regularly updated as SL teams refine boundaries and provide additional information. See also: http://www1.cifor.org/sentinel-landscapes/home.html
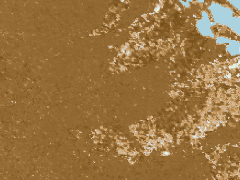
Erosion prevalence - Amrutha, India
- March 1, 2016, 3:48 a.m.
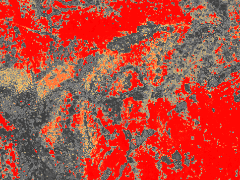
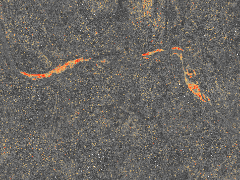
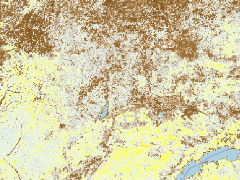
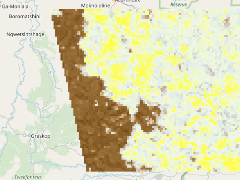
This map shows predicted soil erosion prevalence in %, based on the Land Degradation Surveillance Framework (LDSF) and RapidEye imagery.
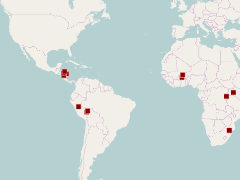
FTA Sentinel Landscapes - sites completed December 2015sl_sites_completed_1
- March 14, 2016, noon
Location of LDSF sentinel sites that have been completed as part of the Sentinel Landscapes Initiative.
Sentinel Sites - Land Degradation Surveillance Framework
- June 6, 2016, 7:39 a.m.
Land Degradation Surveillance Framework Sentinel sites - center points.
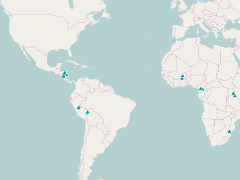
SL LDSF sites - June 2016
- July 28, 2016, 4:40 a.m.
LDSF sentinel site centroids for the sites with (biophysical) field data collection complete by mid-2016.
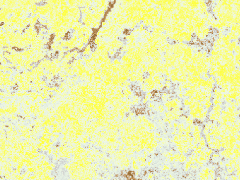
Erosion prevalence - Cassou, Burkina Faso
- Feb. 29, 2016, 5:42 p.m.
This map shows predicted soil erosion prevalence in %, based on the Land Degradation Surveillance Framework (LDSF) and RapidEye imagery.
Erosion prevalence - El Tuma, Nicaragua
- Feb. 29, 2016, 7:03 a.m.
This map shows predicted soil erosion prevalence in %, based on the Land Degradation Surveillance Framework (LDSF) and RapidEye imagery.
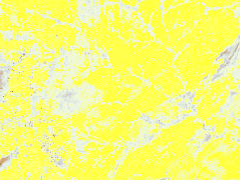
Erosion prevalence - Kongoussi, Burkina Faso
- Feb. 29, 2016, 7:36 a.m.
This map shows predicted soil erosion prevalence in %, based on the Land Degradation Surveillance Framework (LDSF) and RapidEye imagery.
Erosion prevalence - Bushbuckridge, South Africa
- March 1, 2016, 3:16 a.m.
This map shows predicted soil erosion prevalence in %, based on the Land Degradation Surveillance Framework (LDSF) and RapidEye imagery.
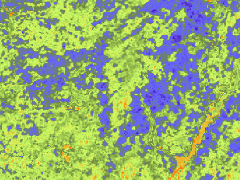
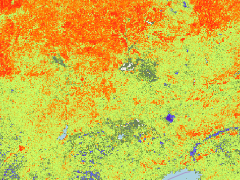
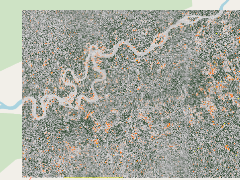
CI - Fractional Vegetation Cover, 2015 [198/56]]
- June 6, 2016, 4:51 a.m.
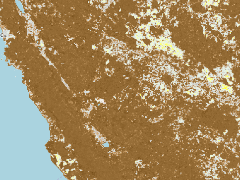
Fractional vegetation cover, based on the Soil Adjusted Total Vegetation Index (SATVI)* for December 2015. *Marsett, R.C., Qi, J., Heilman, P., Biedenbender, S.H., Watson, M.C., Amer, S., Weltz, M., Goodrich, D., Marsett, R., 2006. Remote Sensing for Grassland Management in the Arid Southwest. Rangel. Ecol. Manag. 59, 530–540. doi:10.2111/05-201R.1
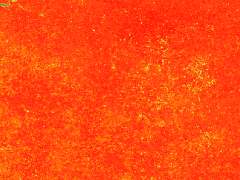
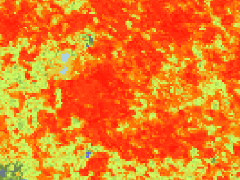
CI - Fractional Vegetation Cover, 1988 [198/56]]
- June 6, 2016, 4:43 a.m.
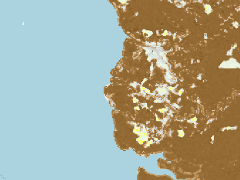
Fractional vegetation cover, based on the Soil Adjusted Total Vegetation Index (SATVI)* for December 1988. *Marsett, R.C., Qi, J., Heilman, P., Biedenbender, S.H., Watson, M.C., Amer, S., Weltz, M., Goodrich, D., Marsett, R., 2006. Remote Sensing for Grassland Management in the Arid Southwest. Rangel. Ecol. Manag. 59, 530–540. doi:10.2111/05-201R.1
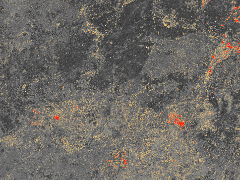
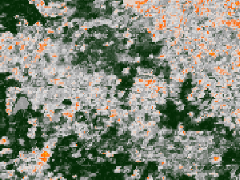
Erosion 2012 - Cameroon
- Aug. 25, 2016, 1:19 a.m.
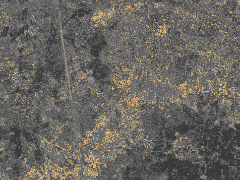
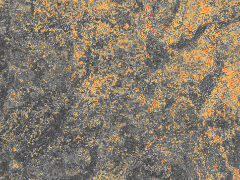
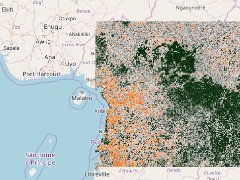
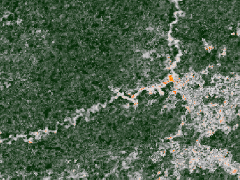
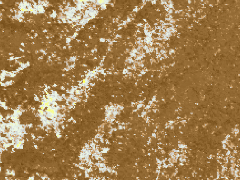
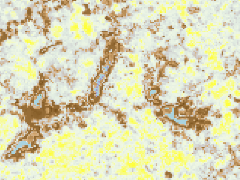
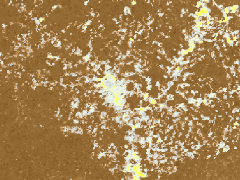
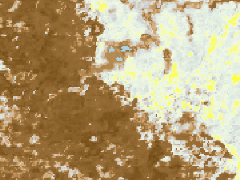
Predicted soil erosion prevalence in 2012 based on MODIS reflectance data. The map shows erosion in % for each MODIS pixel.
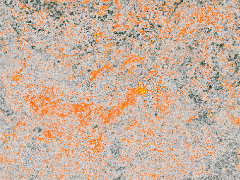
Erosion 2012 - Honduras
- Aug. 25, 2016, 1:20 a.m.
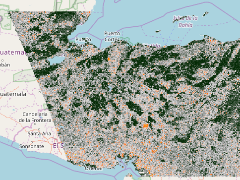
Predicted soil erosion prevalence in 2012 based on MODIS reflectance data. The map shows erosion in % for each MODIS pixel.
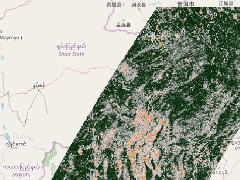
Erosion 2012 - Mekong
- Aug. 25, 2016, 1:21 a.m.
Predicted soil erosion prevalence in 2012 based on MODIS reflectance data. The map shows erosion in % for each MODIS pixel.
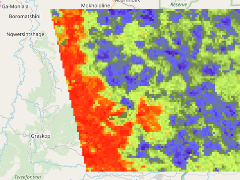
Erosion 2012 - Nicaragua
- Aug. 25, 2016, 1:24 a.m.
Predicted soil erosion prevalence in 2012 based on MODIS reflectance data. The map shows erosion in % for each MODIS pixel.
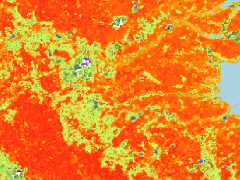
Erosion 2012 - Nile Congo
- Aug. 25, 2016, 1:25 a.m.
Predicted soil erosion prevalence in 2012 based on MODIS reflectance data. The map shows erosion in % for each MODIS pixel.
Erosion 2012 - Peru
- Aug. 25, 2016, 1:27 a.m.
Predicted soil erosion prevalence in 2012 based on MODIS reflectance data. The map shows erosion in % for each MODIS pixel.
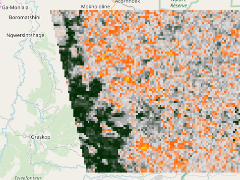
Erosion 2012 - South Africa
- Aug. 25, 2016, 1:28 a.m.
Predicted soil erosion prevalence in 2012 based on MODIS reflectance data. The map shows erosion in % for each MODIS pixel.
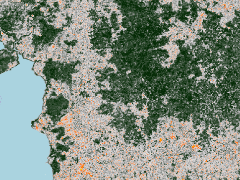
Erosion 2012 - Sumatra
- Aug. 25, 2016, 1:30 a.m.
Predicted soil erosion prevalence in 2012 based on MODIS reflectance data. The map shows erosion in % for each MODIS pixel.
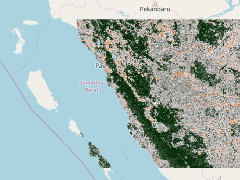
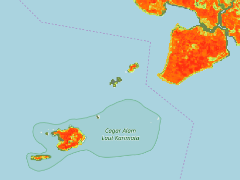
Erosion 2012 - West Kalimantan
- Aug. 25, 2016, 1:31 a.m.
Predicted soil erosion prevalence in 2012 based on MODIS reflectance data. The map shows erosion in % for each MODIS pixel.
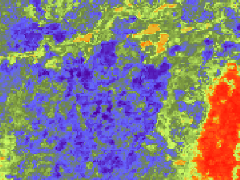
Erosion 2012 - Western Ghats
- Aug. 25, 2016, 1:32 a.m.
Predicted soil erosion prevalence in 2012 based on MODIS reflectance data. The map shows erosion in % for each MODIS pixel.
Erosion 2012 - Burkina Faso / Ghana SL
- Aug. 25, 2016, 1:39 a.m.
Predicted soil erosion prevalence in 2012 based on MODIS reflectance data. The map shows erosion in % for each MODIS pixel.
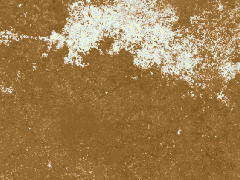
Soil organic carbon (SOC) 2012 - Cameroon
- Aug. 25, 2016, 1:56 a.m.
Map of soil organic carbon (SOC) for 2012. Value displayed when clicking on the map using the "Identify" button is pH*100. For a detailed description of the methods used to generate this map see: Vågen, T.-G., Winowiecki, L.A., Tondoh, J.E., Desta, L.T., Gumbricht, T., 2016. Mapping of soil properties and land degradation risk in Africa using MODIS reflectance. Geoderma 263, 216–225. doi:10.1016/j.geoderma.2015.06.023.
Soil organic carbon (SOC) 2012 - Mekong
- Aug. 25, 2016, 2:01 a.m.
Map of soil organic carbon (SOC) for 2012. Value displayed when clicking on the map using the "Identify" button is pH*100. For a detailed description of the methods used to generate this map see: Vågen, T.-G., Winowiecki, L.A., Tondoh, J.E., Desta, L.T., Gumbricht, T., 2016. Mapping of soil properties and land degradation risk in Africa using MODIS reflectance. Geoderma 263, 216–225. doi:10.1016/j.geoderma.2015.06.023.
Soil organic carbon (SOC) 2012 - Miombo
- Aug. 25, 2016, 2:05 a.m.
Map of soil organic carbon (SOC) for 2012. Value displayed when clicking on the map using the "Identify" button is pH*100. For a detailed description of the methods used to generate this map see: Vågen, T.-G., Winowiecki, L.A., Tondoh, J.E., Desta, L.T., Gumbricht, T., 2016. Mapping of soil properties and land degradation risk in Africa using MODIS reflectance. Geoderma 263, 216–225. doi:10.1016/j.geoderma.2015.06.023.
Soil organic carbon (SOC) 2012 - Nicaragua
- Aug. 25, 2016, 2:08 a.m.
Map of soil organic carbon (SOC) for 2012. Value displayed when clicking on the map using the "Identify" button is pH*100. For a detailed description of the methods used to generate this map see: Vågen, T.-G., Winowiecki, L.A., Tondoh, J.E., Desta, L.T., Gumbricht, T., 2016. Mapping of soil properties and land degradation risk in Africa using MODIS reflectance. Geoderma 263, 216–225. doi:10.1016/j.geoderma.2015.06.023.
Soil organic carbon (SOC) 2012 - Nile Congo
- Aug. 25, 2016, 2:11 a.m.
Map of soil organic carbon (SOC) for 2012. Value displayed when clicking on the map using the "Identify" button is pH*100. For a detailed description of the methods used to generate this map see: Vågen, T.-G., Winowiecki, L.A., Tondoh, J.E., Desta, L.T., Gumbricht, T., 2016. Mapping of soil properties and land degradation risk in Africa using MODIS reflectance. Geoderma 263, 216–225. doi:10.1016/j.geoderma.2015.06.023.
Soil organic carbon (SOC) 2012 - Peru
- Aug. 25, 2016, 2:16 a.m.
Map of soil organic carbon (SOC) for 2012. Value displayed when clicking on the map using the "Identify" button is pH*100. For a detailed description of the methods used to generate this map see: Vågen, T.-G., Winowiecki, L.A., Tondoh, J.E., Desta, L.T., Gumbricht, T., 2016. Mapping of soil properties and land degradation risk in Africa using MODIS reflectance. Geoderma 263, 216–225. doi:10.1016/j.geoderma.2015.06.023.
Soil organic carbon (SOC) 2012 - South Africa
- Aug. 25, 2016, 2:17 a.m.
Map of soil organic carbon (SOC) for 2012. Value displayed when clicking on the map using the "Identify" button is pH*100. For a detailed description of the methods used to generate this map see: Vågen, T.-G., Winowiecki, L.A., Tondoh, J.E., Desta, L.T., Gumbricht, T., 2016. Mapping of soil properties and land degradation risk in Africa using MODIS reflectance. Geoderma 263, 216–225. doi:10.1016/j.geoderma.2015.06.023.
Soil organic carbon (SOC) 2012 - Sumatra
- Aug. 25, 2016, 2:17 a.m.
Map of soil organic carbon (SOC) for 2012. Value displayed when clicking on the map using the "Identify" button is pH*100. For a detailed description of the methods used to generate this map see: Vågen, T.-G., Winowiecki, L.A., Tondoh, J.E., Desta, L.T., Gumbricht, T., 2016. Mapping of soil properties and land degradation risk in Africa using MODIS reflectance. Geoderma 263, 216–225. doi:10.1016/j.geoderma.2015.06.023.
Soil organic carbon (SOC) 2012 - West kalimantan
- Aug. 25, 2016, 2:18 a.m.
Map of soil organic carbon (SOC) for 2012. Value displayed when clicking on the map using the "Identify" button is pH*100. For a detailed description of the methods used to generate this map see: Vågen, T.-G., Winowiecki, L.A., Tondoh, J.E., Desta, L.T., Gumbricht, T., 2016. Mapping of soil properties and land degradation risk in Africa using MODIS reflectance. Geoderma 263, 216–225. doi:10.1016/j.geoderma.2015.06.023.
Soil organic carbon (SOC) 2012 - Western ghats
- Aug. 25, 2016, 2:19 a.m.
Map of soil organic carbon (SOC) for 2012. Value displayed when clicking on the map using the "Identify" button is pH*100. For a detailed description of the methods used to generate this map see: Vågen, T.-G., Winowiecki, L.A., Tondoh, J.E., Desta, L.T., Gumbricht, T., 2016. Mapping of soil properties and land degradation risk in Africa using MODIS reflectance. Geoderma 263, 216–225. doi:10.1016/j.geoderma.2015.06.023.
Soil pH 2012 - Burkina Faso
- Aug. 25, 2016, 3:35 a.m.
Map of soil pH for 2012. Value displayed when clicking on the map using the "Identify" button is pH*100. For a detailed description of the methods used to generate this map see: Vågen, T.-G., Winowiecki, L.A., Tondoh, J.E., Desta, L.T., Gumbricht, T., 2016. Mapping of soil properties and land degradation risk in Africa using MODIS reflectance. Geoderma 263, 216–225. doi:10.1016/j.geoderma.2015.06.023.
Soil pH 2012 - Cameroon
- Aug. 25, 2016, 3:37 a.m.
Map of soil pH for 2012. Value displayed when clicking on the map using the "Identify" button is pH*100. For a detailed description of the methods used to generate this map see: Vågen, T.-G., Winowiecki, L.A., Tondoh, J.E., Desta, L.T., Gumbricht, T., 2016. Mapping of soil properties and land degradation risk in Africa using MODIS reflectance. Geoderma 263, 216–225. doi:10.1016/j.geoderma.2015.06.023.
Soil pH 2012 - Honduras
- Aug. 25, 2016, 3:38 a.m.
Map of soil pH for 2012. Value displayed when clicking on the map using the "Identify" button is pH*100. For a detailed description of the methods used to generate this map see: Vågen, T.-G., Winowiecki, L.A., Tondoh, J.E., Desta, L.T., Gumbricht, T., 2016. Mapping of soil properties and land degradation risk in Africa using MODIS reflectance. Geoderma 263, 216–225. doi:10.1016/j.geoderma.2015.06.023.
Soil pH 2012 - Mekong
- Aug. 25, 2016, 3:39 a.m.
Map of soil pH for 2012. Value displayed when clicking on the map using the "Identify" button is pH*100. For a detailed description of the methods used to generate this map see: Vågen, T.-G., Winowiecki, L.A., Tondoh, J.E., Desta, L.T., Gumbricht, T., 2016. Mapping of soil properties and land degradation risk in Africa using MODIS reflectance. Geoderma 263, 216–225. doi:10.1016/j.geoderma.2015.06.023.
Soil pH 2012 - Miombo
- Aug. 25, 2016, 3:42 a.m.
Map of soil pH for 2012. Value displayed when clicking on the map using the "Identify" button is pH*100. For a detailed description of the methods used to generate this map see: Vågen, T.-G., Winowiecki, L.A., Tondoh, J.E., Desta, L.T., Gumbricht, T., 2016. Mapping of soil properties and land degradation risk in Africa using MODIS reflectance. Geoderma 263, 216–225. doi:10.1016/j.geoderma.2015.06.023.
Soil pH 2012 - Nicaragua
- Aug. 25, 2016, 3:43 a.m.
Map of soil pH for 2012. Value displayed when clicking on the map using the "Identify" button is pH*100. For a detailed description of the methods used to generate this map see: Vågen, T.-G., Winowiecki, L.A., Tondoh, J.E., Desta, L.T., Gumbricht, T., 2016. Mapping of soil properties and land degradation risk in Africa using MODIS reflectance. Geoderma 263, 216–225. doi:10.1016/j.geoderma.2015.06.023.
Soil pH 2012 - Nile Congo
- Aug. 25, 2016, 3:45 a.m.
Map of soil pH for 2012. Value displayed when clicking on the map using the "Identify" button is pH*100. For a detailed description of the methods used to generate this map see: Vågen, T.-G., Winowiecki, L.A., Tondoh, J.E., Desta, L.T., Gumbricht, T., 2016. Mapping of soil properties and land degradation risk in Africa using MODIS reflectance. Geoderma 263, 216–225. doi:10.1016/j.geoderma.2015.06.023.
Soil pH 2012 - Peru
- Aug. 25, 2016, 3:49 a.m.
Map of soil pH for 2012. Value displayed when clicking on the map using the "Identify" button is pH*100. For a detailed description of the methods used to generate this map see: Vågen, T.-G., Winowiecki, L.A., Tondoh, J.E., Desta, L.T., Gumbricht, T., 2016. Mapping of soil properties and land degradation risk in Africa using MODIS reflectance. Geoderma 263, 216–225. doi:10.1016/j.geoderma.2015.06.023.
Soil pH 2012 - South Africa
- Aug. 25, 2016, 3:50 a.m.
Map of soil pH for 2012. Value displayed when clicking on the map using the "Identify" button is pH*100. For a detailed description of the methods used to generate this map see: Vågen, T.-G., Winowiecki, L.A., Tondoh, J.E., Desta, L.T., Gumbricht, T., 2016. Mapping of soil properties and land degradation risk in Africa using MODIS reflectance. Geoderma 263, 216–225. doi:10.1016/j.geoderma.2015.06.023.
Soil pH 2012 - Sumatra
- Aug. 25, 2016, 3:53 a.m.
Map of soil pH for 2012. Value displayed when clicking on the map using the "Identify" button is pH*100. For a detailed description of the methods used to generate this map see: Vågen, T.-G., Winowiecki, L.A., Tondoh, J.E., Desta, L.T., Gumbricht, T., 2016. Mapping of soil properties and land degradation risk in Africa using MODIS reflectance. Geoderma 263, 216–225. doi:10.1016/j.geoderma.2015.06.023.
Soil pH 2012 - West Kalimantan
- Aug. 25, 2016, 3:55 a.m.
Map of soil pH for 2012. Value displayed when clicking on the map using the "Identify" button is pH*100. For a detailed description of the methods used to generate this map see: Vågen, T.-G., Winowiecki, L.A., Tondoh, J.E., Desta, L.T., Gumbricht, T., 2016. Mapping of soil properties and land degradation risk in Africa using MODIS reflectance. Geoderma 263, 216–225. doi:10.1016/j.geoderma.2015.06.023.
Soil pH 2012 - Western ghats
- Aug. 25, 2016, 3:58 a.m.
Map of soil pH for 2012. Value displayed when clicking on the map using the "Identify" button is pH*100. For a detailed description of the methods used to generate this map see: Vågen, T.-G., Winowiecki, L.A., Tondoh, J.E., Desta, L.T., Gumbricht, T., 2016. Mapping of soil properties and land degradation risk in Africa using MODIS reflectance. Geoderma 263, 216–225. doi:10.1016/j.geoderma.2015.06.023.
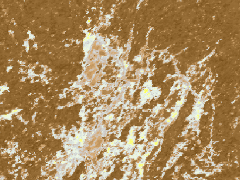
Soil organic carbon (SOC) 2012 - Honduras
- Aug. 25, 2016, 1:58 a.m.
Map of soil organic carbon (SOC) for 2012. Value displayed when clicking on the map using the "Identify" button is pH*100. For a detailed description of the methods used to generate this map see: Vågen, T.-G., Winowiecki, L.A., Tondoh, J.E., Desta, L.T., Gumbricht, T., 2016. Mapping of soil properties and land degradation risk in Africa using MODIS reflectance. Geoderma 263, 216–225. doi:10.1016/j.geoderma.2015.06.023.
Soil organic carbon (SOC) 2012 - Burkina Faso / Ghana SL
- Aug. 25, 2016, 1:54 a.m.
Map of soil organic carbon (SOC) for 2012. Value displayed when clicking on the map using the "Identify" button is pH*100. For a detailed description of the methods used to generate this map see: Vågen, T.-G., Winowiecki, L.A., Tondoh, J.E., Desta, L.T., Gumbricht, T., 2016. Mapping of soil properties and land degradation risk in Africa using MODIS reflectance. Geoderma 263, 216–225. doi:10.1016/j.geoderma.2015.06.023.
Soil organic carbon (SOC) - BRACED, Chad
- April 24, 2017, 6:48 a.m.
Map of soil organic carbon (SOC) in the topsoil (0-20cm) for the BRACED project watershed in Chad.
Erosion prevalence - Madre de Dios, Peru
- Feb. 29, 2016, 8:05 a.m.
This map shows predicted soil erosion prevalence in %, based on the Land Degradation Surveillance Framework (LDSF) and RapidEye imagery.
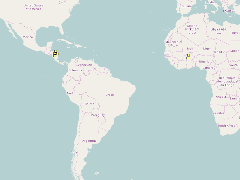
LDSF sites completed in the Sentinel Landscapes
- Aug. 5, 2014, 4:40 a.m.
Overview of LDSF sites that have been completed as part of the Sentinel Landscapes Initiative.
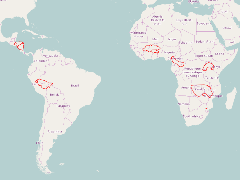
Sentinel Landscapes boundaries: 2013-2014
- Aug. 18, 2014, 5:13 a.m.
Boundaries of FTA Sentinel Landscapes boundaries as per August 2014.

Land health maps - BRACED, Chad
- April 24, 2017, 7 a.m.

LDSF field guide (2013)
- Dec. 19, 2014, 1:38 a.m.
The LDSF is designed to provide a biophysical baseline at landscape level, and a monitoring and evaluation framework for assessing processes of land degradation and the effectiveness of rehabilitation measures (recovery) over time.

LDSF field guide (v 2020)
- May 25, 2017, 2:59 a.m.
The LDSF is designed to provide a biophysical baseline at landscape level, and a monitoring and evaluation framework for assessing processes of land degradation and the effectiveness of rehabilitation measures (recovery) over time. Updated on 2019-02-09
Recent Posts
We work towards the application of GeoScience in real decision contexts, such as climate change adaptation, hydrological effects of changes in climate and land cover, targeting of agroforestry interventions, provision of soil fertility and surveillance advisory services for smallholder farmers, digital soil and land use/cover mapping, and measuring impacts of interventions, all using open source software.